page

Mar 31, 2021

DEG analysis without biological Replication

 DEG analysis without biological Replication

https://www.researchgate.net/post/DEG_analysis_without_biological_Replication


->
Without replicates, you cannot estimate which genes are differentially expressed using EdgeR or DESeq2. You can only calculate fold changes based on normalized read counts (preferentially CPM normalized by TMM method included in any EdgeR analysis) and apply a stringent fold-change cut-off to determine which genes are more or less expressed depending on the condition.

->
it might be able to assume certain samples as biological replicates. I recommend you check your samples' clustering using a PCA plot (explained in the DESeq2 manual/workflow), this  is a good way of exploring your data. For example, if you have 4 control samples and 4 treatment samples it might be that all your control samples make one o group and they together differentiate from your treatment samples. If this is the case, one could argue that for the purpose of analysing DEG between treatment and control one could consider all the control samples as replicates, same would apply for the treatment samples. However, the relevance of this approach will depend on the nature of the experimental setup.

Mar 10, 2021

Docker for bioinformatics - biocontainers

https://hub.docker.com/u/biocontainers/


Docker overview 

 
Docker is an open platform for developing, shipping, and running applications. Docker enables you to separate your applications from your infrastructure so you can deliver software quickly. With Docker, you can manage your infrastructure in the same ways you manage your applications. By taking advantage of Docker’s methodologies for shipping, testing, and deploying code quickly, you can significantly reduce the delay between writing code and running it in production.
Docker Architecture Diagram

Ct, Cq, Rn value in qRT-PCR

What Is a Cq (Ct) Value?

 https://bitesizebio.com/24581/what-is-a-ct-value/

Ct – threshold cycle
Cp – crossing point
TOP – take-off point
Cq – quantification cycle 
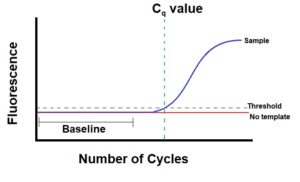

Image of a qPCR graph showing how the Cq value is obtained

Good summary for qRT-PCR

https://www.thermofisher.com/us/en/home/life-science/pcr/real-time-pcr/real-time-pcr-learning-center.html 


https://www.thermofisher.com/content/dam/LifeTech/Documents/PDFs/PG1503-PJ9169-CO019879-Re-brand-Real-Time-PCR-Understanding-Ct-Value-Americas-FHR.pdf


Rn value

https://www.qiagen.com/us/resources/faq?id=ee18399a-b88b-43ef-9929-27d79ef9ed09&lang=en

 The Rn value, or normalized reporter value, is the fluorescent signal from SYBR Green normalized to (divided by) the signal of the passive reference dye for a given reaction. The delta Rn value is the Rn value of an experimental reaction minus the Rn value of the baseline signal generated by the instrument. This parameter reliably calculates the magnitude of the specific signal generated from a given set of PCR conditions. For more information, please refer to your cycler's user manual.


RSEM : RNA-Seq transcript quantification

RSEM: accurate transcript quantification from RNA-Seq data with or without a reference genome

 BMC Bioinformatics volume 12, Article number: 323 (2011

 https://bmcbioinformatics.biomedcentral.com/articles/10.1186/1471-2105-12-323

RNA-Seq gene expression estimation with read mapping uncertainty

Bioinformatics, Volume 26, Issue 4, 15 February 2010, Pages 493–500

 https://doi.org/10.1093/bioinformatics/btp692


RSEM tutorial

https://github.com/bli25broad/RSEM_tutorial