page

Mar 31, 2020

R for Data Science

https://r4ds.had.co.nz/

Cover image
how to get your data into R, get it into the most useful structure, transform it, visualise it and model it.

Mar 25, 2020

changing chromosome notation in .BAM file

http://seqanswers.com/forums/showthread.php?t=22504


https://josephcckuo.wordpress.com/2016/11/17/modify-chromosome-notation-in-bam-file/


change chromosome notation "1" to "chr1"

for file in *.bam; do filename=`echo $file | cut -d "." -f 1`; samtools view -H $file | sed -e 's/SN:\([0-9XY]\)/SN:chr\1/' -e 's/SN:MT/SN:chrM/' | samtools reheader - $file > ${filename}_chr.bam; done


for loop

for file in *.bam; do filename=`echo $file | cut -d "." -f 1`; samtools view -H $file | sed -e 's/SN:\([0-9XY]\)/SN:chr\1/' -e 's/SN:MT/SN:chrM/' | samtools reheader - $file > ${filename}_chr.bam; done

Mar 24, 2020

deepTools: tools for exploring deep sequencing data

https://deeptools.readthedocs.io/en/latest/index.html

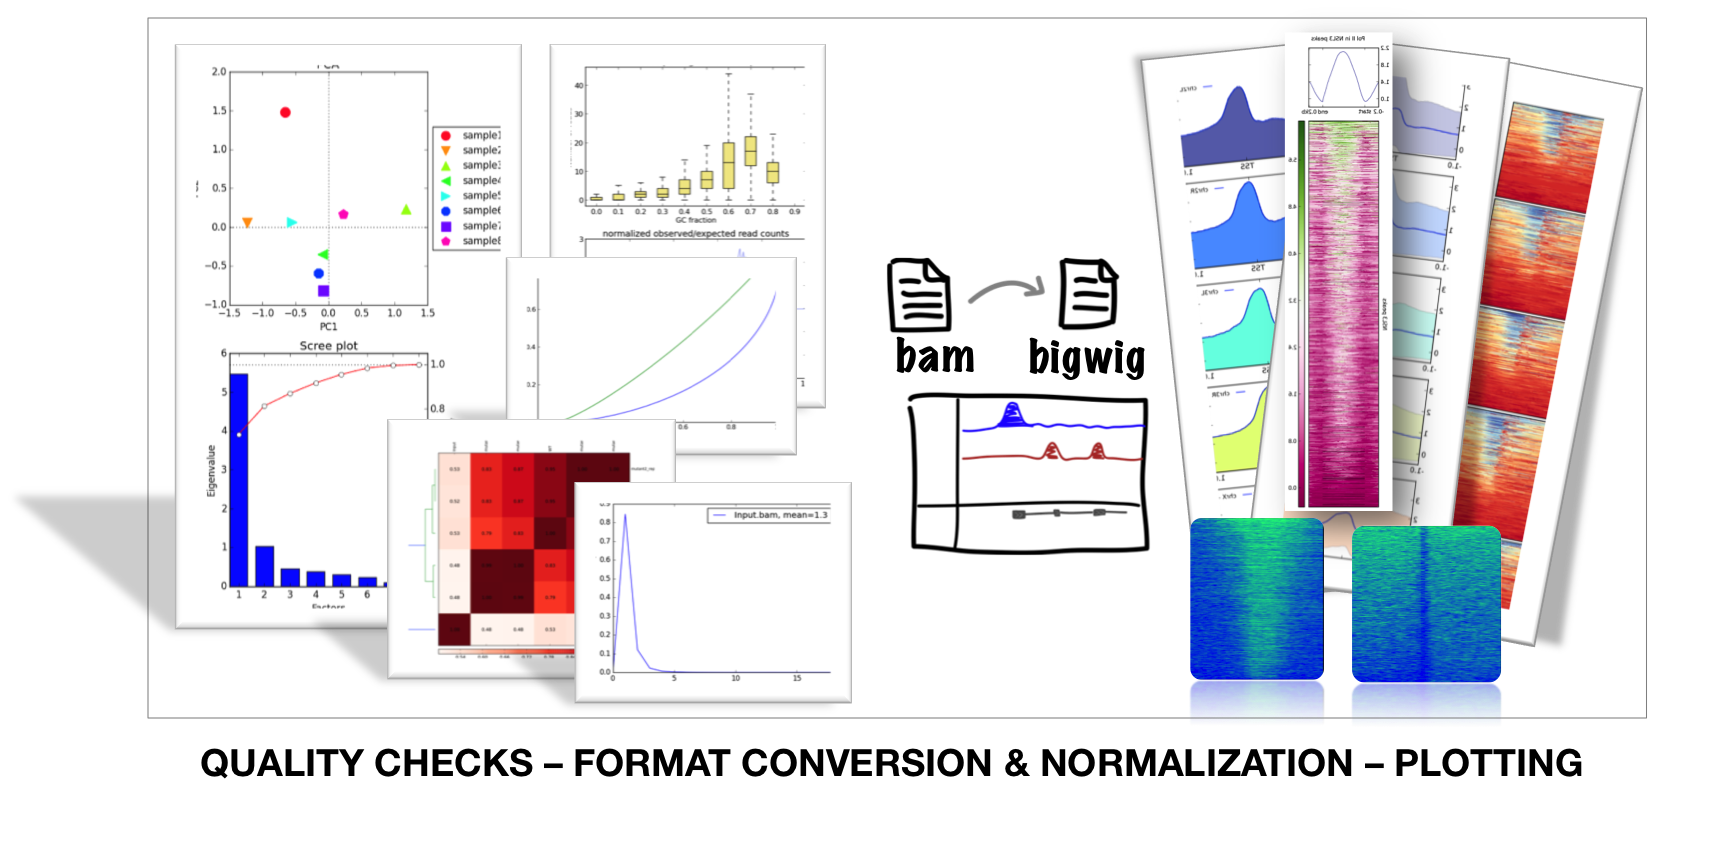
deepTools is a suite of python tools particularly developed for the efficient analysis of high-throughput sequencing data, such as ChIP-seq, RNA-seq or MNase-seq.
_images/start_collage.png


_images/start_workflow1.png

Mar 4, 2020

Violinplot for Matlab

https://github.com/bastibe/Violinplot-Matlab

example image

SeqPlots : interactive tool for visualizing track signals and sequence motif densities along genomic features using average plots and heatmaps

https://github.com/Przemol/seqplots

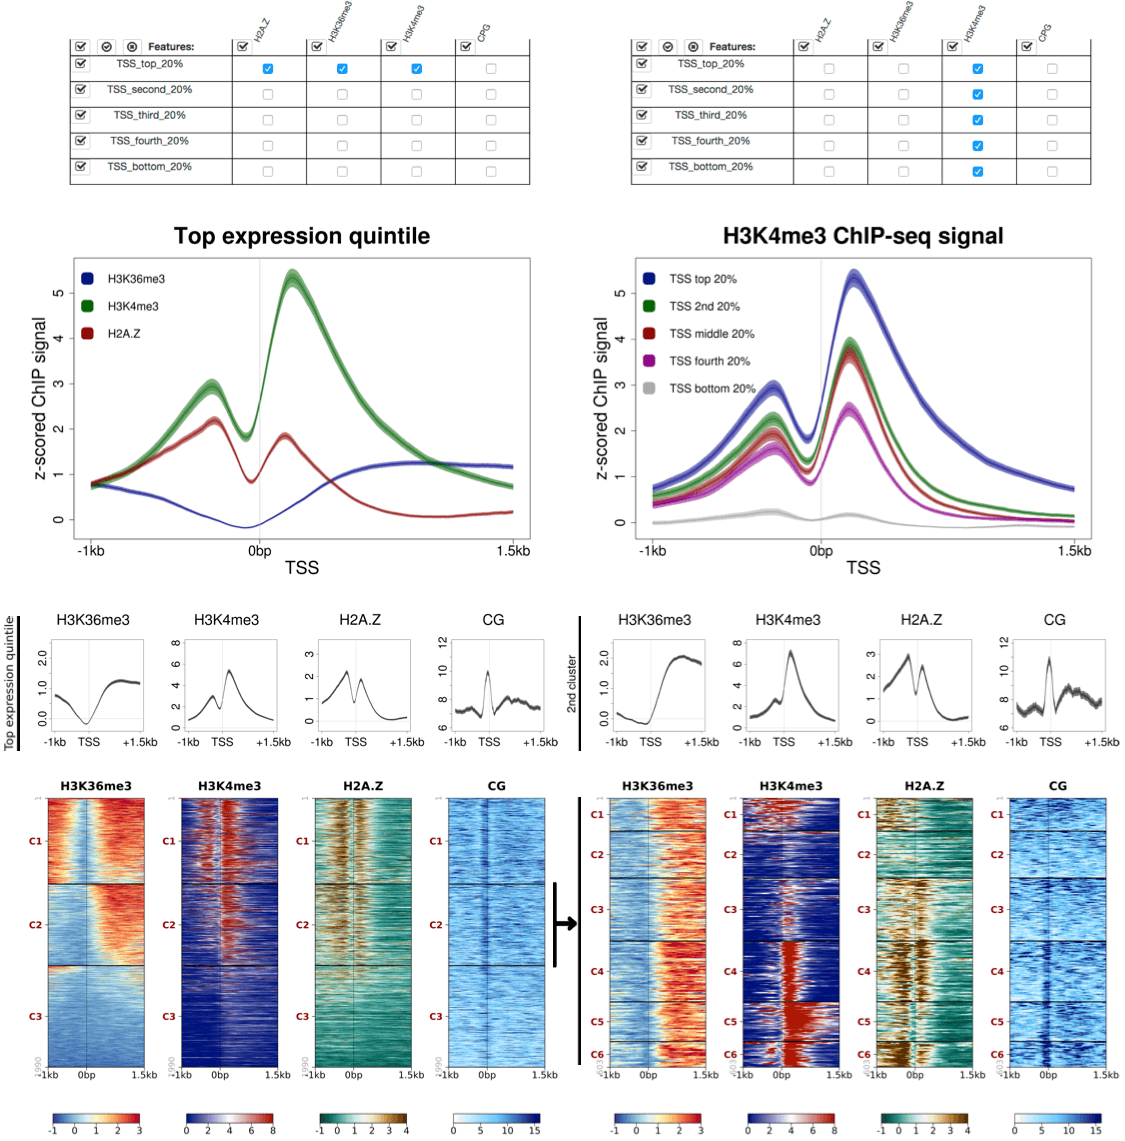
 SeqPlots is a web browser tool for plotting average track signals (e.g. read coverage) and sequence motif densities over user-specified genomic features.

Standalone versions of SeqPlots are available as a Mac OS X (10.6 or higher) app bundle combing R, all required packages and scripts([subproject home]) or as an R package ([subproject home]). 

Examples of Seq Plots interface and outputs