Babyplots Documentation
Babyplots is an easy to use library for creating interactive 3d graphs for exploring and presenting data.
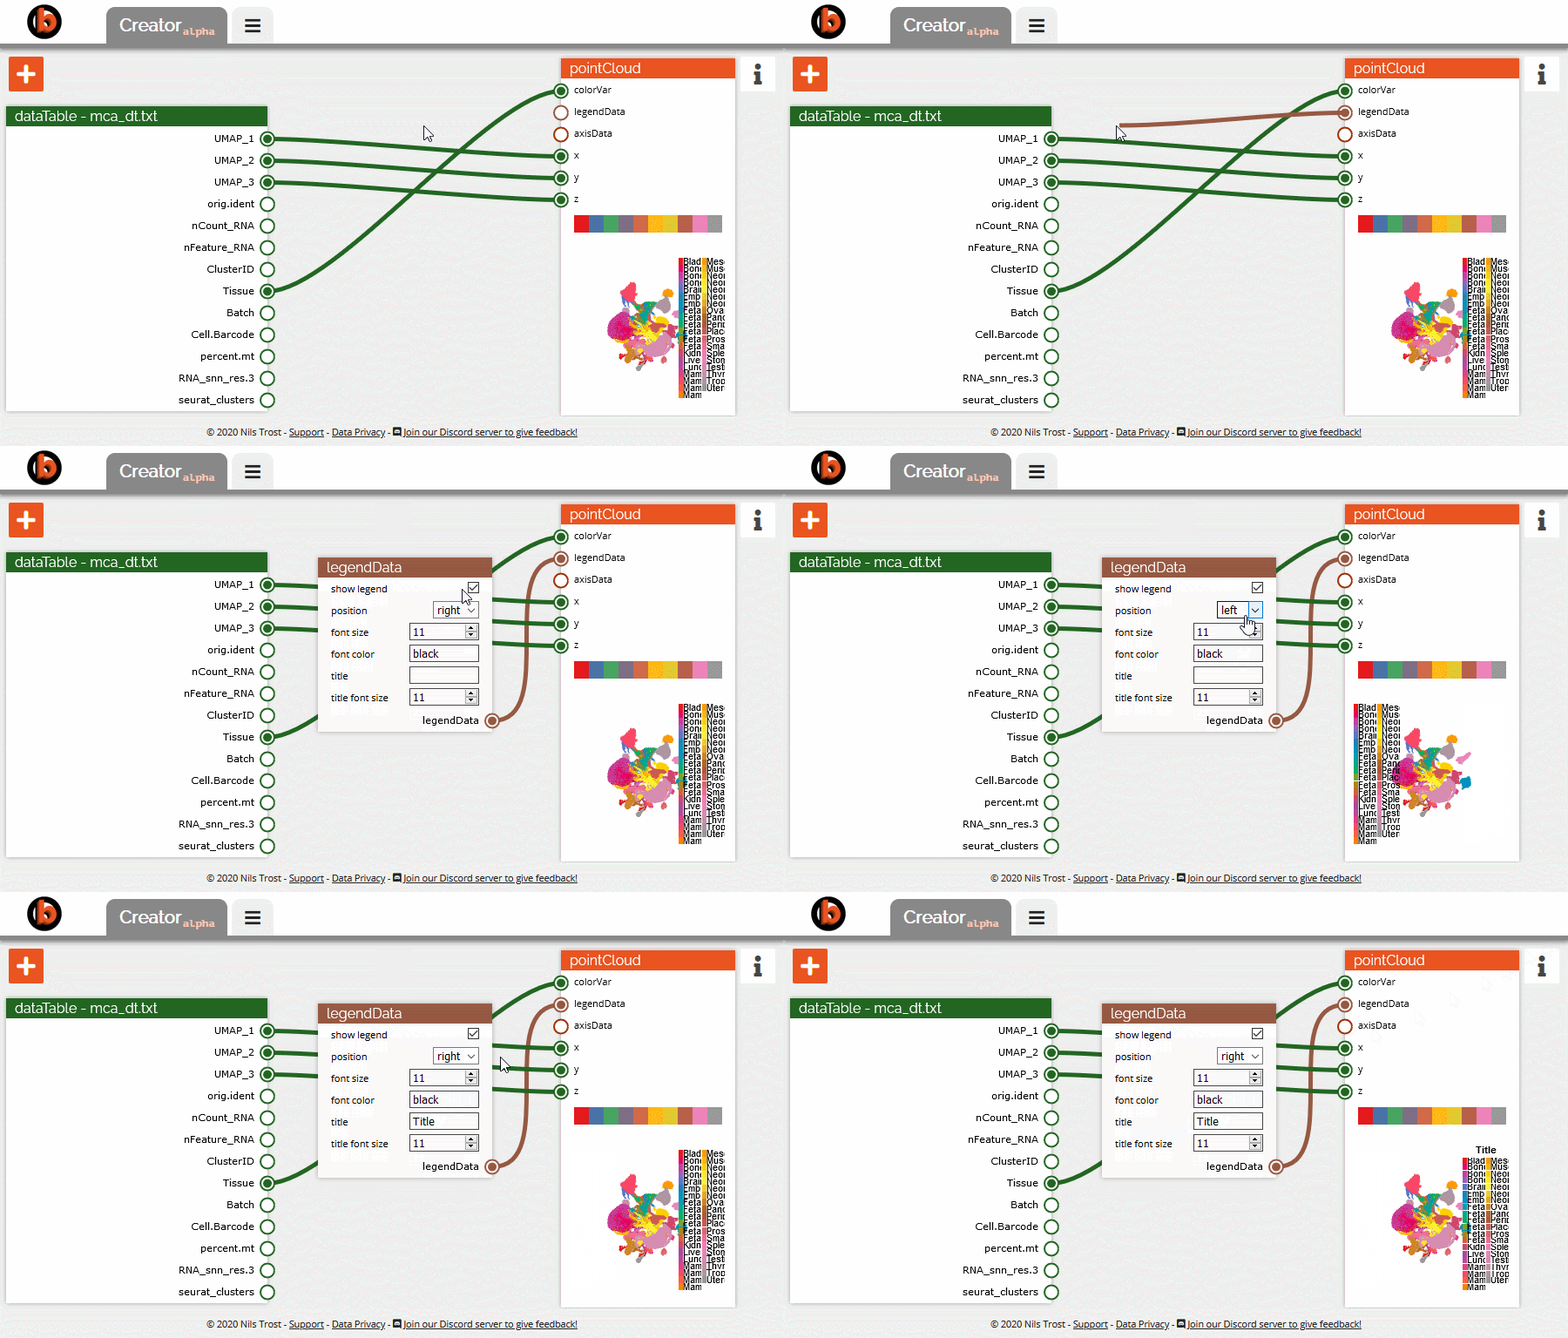
Babyplots is available as a JavaScript library, as an R package, as a Python package, and as an add-in for Microsoft PowerPoint. While the R package, Python package and JavaScript library allow the creation of new plots, the PowerPoint add-in can only be used to display exported plots. This website also provides an interactive node-based editor for creating babyplots visualizations called NPC (node plot creator) or simply Creator.
Find the individual documentation pages through the links below:

No comments:
Post a Comment