Articles about common next-generation sequencing problems
https://sequencing.qcfail.com/
Apr 8, 2019
Statistical significance of the overlap between two groups of genes : hypergeometric distribution
Statistical significance of the overlap between two groups of genes
http://nemates.org/MA/progs/overlap_stats.htmlHow do I calculate if the degree of overlap between two lists is significant?
https://stats.stackexchange.com/questions/267/how-do-i-calculate-if-the-degree-of-overlap-between-two-lists-is-significant
If I understand your question correctly, you need to use the Hypergeometric distribution. This distribution is usually associated with urn models, i.e there are n balls in an urn, y are painted red, and you draw m balls from the urn. Then if X is the number of balls in your sample of m that are red, X has a hyper-geometric distribution.
For your specific example, letnA , nB and nC denote the lengths of your three lists and let nAB denote the overlap between A and B . Then
nAB∼HG(nA,nC,nB)
To calculate a p-value, you could use this R command:
For your specific example, let
To calculate a p-value, you could use this R command:
#Some example values
n_A = 100;n_B = 200; n_C = 500; n_A_B = 50
1-phyper(n_A_B, n_B, n_C-n_B, n_A)
[1] 0.008626697
csgillespie's answer seems correct except for one thing: it gives the probability of seeing strictly more than n_A_B in the overlap, P(x > n_A_B), but I think OP wants the pvalue P(x >= n_A_B). You could get the latter by
n_A = 100;n_B = 200; n_C = 500; n_A_B = 50
phyper(n_A_B - 1, n_A, n_C-n_A, n_B, lower.tail = FALSE)
samtools rmdup vs Picard MarkDuplicates
samtools rmdup PE
http://seqanswers.com/forums/showthread.php?t=5959
If you have one pair of reads where read 1 starts at position 100, and the other end starts at position 200, and a second pair of reads where read 1 starts at position 100, and read 2 starts at position 250, those came from different fragments of DNA. You can tell because the read 2 start is different, even though the read 1 start is the same.
When treating the reads as paired end, none of those reads should be deleted as PCR duplicates.
However, if you ran rmdup -S, the software will not check to see if read 2 has a different start coordinate, so one of those read 1 reads will be treated as a duplicate, and deleted.
Question: Samtools Dedup Documentation
https://www.biostars.org/p/55111/
rmdup for PE reads is pretty straightforward. It looks for identical external coordinates, meaning it only looks at the 5' start coordinates of the FR orientation pair-reads. Then it takes the pair with the highest mapping quality.
For SE reads, I've read that samtools also only looks for identical 5' start coordinates, not both start and end coordinates. I think the idea is that sequencers usually fall in quality towards the 3'. After mapping, duplicate reads have higher chance of mapping differentially towards the 3' end. So it only looks at the adapter trimmed 5' start for duplicates.
Question: Picard MarkDuplicates and SamTools rmdup algorithm documentation
https://www.biostars.org/p/105291/
SamTools rmdup 'only' compare two reads on chrom and pos (which could be wrong if two reads come from two different libraries) and **removes** reads from the BAM: information is lost.
picard set the sam flag 1024 but do not delete the reads. two pairs of reads are compared , as far as I know, using the chrom, the pos, the group-id (sample...) + (flowcell , lane, X,Y for optical dups) (,and the cigar string ?).
Picard MarkDuplicates vs samtools rmdup for variant calling with GATK
https://gatkforums.broadinstitute.org/gatk/discussion/6793/picard-markduplicates-vs-samtools-rmdup-for-variant-calling-with-gatk
- this post explains Picard's duplicate marking tools
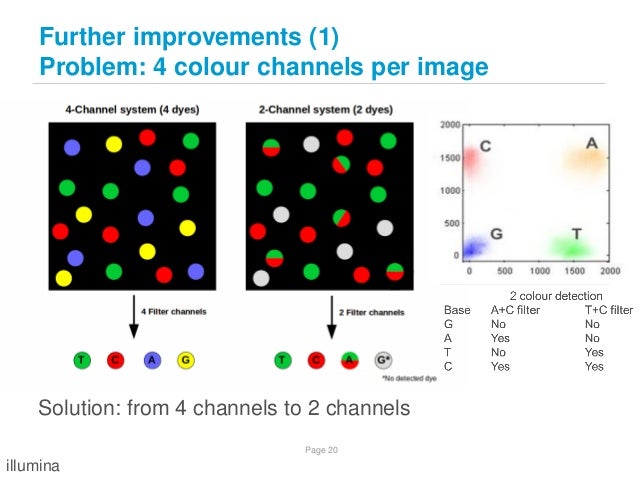
NovaSeq : 2-color chemistry and Base quality problem
Because of 2-color chemistry of Nova-seq, base quality of Nova-seq could be worse compared to Hiseq which uses 4-color chemistry
On NovaSeq Base Quality
http://lh3.github.io/2017/07/24/on-nonvaseq-base-quality
Illumina 2 colour chemistry can overcall high confidence G bases
https://sequencing.qcfail.com/articles/illumina-2-colour-chemistry-can-overcall-high-confidence-g-bases/
WGS from NovaSeq compared to HiSeq
https://www.reddit.com/r/bioinformatics/comments/93eqjm/wgs_from_novaseq_compared_to_hiseq/
A first look at Illumina’s new NextSeq 500 ( NextSeq use 2-color chemistry)
http://seqanswers.com/forums/showthread.php?t=40741
Mar 25, 2019
Adapter trimming tools
Trimmomatic : easy to use, seems it's not updated well
http://www.usadellab.org/cms/?page=trimmomatic
Cutadapt : many option
https://cutadapt.readthedocs.io/en/stable/guide.html
BBDuk : fast
https://jgi.doe.gov/data-and-tools/bbtools/bb-tools-user-guide/bbduk-guide/
Practical comparison of NGS adapter trimming tools
http://bogdan.org.ua/2016/06/01/practical-comparison-of-ngs-adapter-trimming-tools.htmlIntroducing BBDuk: Adapter/Quality Trimming and Filtering
http://seqanswers.com/forums/showthread.php?t=42776
Adapters trimming: Cutadapt vs Trimmomatic
http://seqanswers.com/forums/showthread.php?t=40692
Comparing quality trimming and adapter removing tools
https://www.reddit.com/r/bioinformatics/comments/63nu1f/comparing_quality_trimming_and_adapter_removing/
Nov 27, 2018
HiSeq, MiSeq, NovaSeq : Read length, # of cluster per lane, Base per lane
https://medicine.yale.edu/keck/ycga/sequencing/illumina/hiseq.aspx
https://www.fasteris.com/dna/?q=node/41
Illumina HiSeq Services:
https://www.illumina.com/systems/sequencing-platforms/miseq/specifications.html
* Total time includes cluster generation, sequencing, and base calling on a MiSeq System enabled with dual-surface scanning.
| Sequencer | Read length | # of Clusters per lane (millions) | Bases per lane (Gbp) |
| HiSeq 2500 Rapid | 1x75 | 150 | 11.25 |
| HiSeq 2500 Rapid | 2x75 | 150 | 22.5 |
| HiSeq 2500 Rapid | 2x150 | 150 | 45 |
| HiSeq 2500 High-output | 1x75 | 200 | 15 |
| HiSeq 2500 High-output | 2x75 | 200 | 30 |
| HiSeq 4000 | 2x100 | 300 | 60 |
| HiSeq 4000 | 2x150 | 300 | 90 |
| NovaSeq S2 | 2x100 | 1650 | 330 |
| NovaSeq S2 | 2x150 | 1650 | 500 |
| NovaSeq S4 | 2x150 | 2000 | 600 |
https://www.fasteris.com/dna/?q=node/41
Illumina HiSeq Services:
https://www.illumina.com/systems/sequencing-platforms/miseq/specifications.html
Cluster Generation and Sequencing
| MiSeq Reagent Kit v2 | MiSeq Reagent Kit v3 | |||||
| Read Length | 1 × 36 bp | 2 × 25 bp | 2 × 150 bp | 2 × 250 bp | 2 × 75 bp | 2 × 300 bp |
| Total Time* | ~4 hrs | ~5.5 hrs | ~24 hrs | ~39 hrs | ~21 hrs | ~56 hrs |
| Output | 540–610 Mb | 750–850 Mb | 4.5–5.1 Gb | 7.5–8.5 Gb | 3.3–3.8 Gb | 13.2–15 Gb |
| MiSeq Reagent Kit v2 Micro | MiSeq Reagent Kit v2 Nano | ||
| Read Length | 2 × 150 bp | 2 × 250 bp | 2 × 150 bp |
| Total Time* | ~19 hrs | ~28 hrs | ~17 hrs |
| Output | 1.2 Gb | 500 Mb | 300 Mb |
Reads Passing Filter**
| MiSeq Reagent Kit v2 | MiSeq Reagent Kit v3 | MiSeq Reagent Kit v2 Micro | MiSeq Reagent Kit v2 Nano | |
| Single Reads | 12-15 million | 22–25 million | 4 million | 1 million |
| Paired-End Reads | 24–30 million | 44–50 million | 8 million | 2 million |
** Install specifications based on Illumina PhiX control library at supported cluster densities (865-965 k/mm2 clusters passing filter for v2 chemistry and 1200-1400 k/mm2 clusters passing filter for v3 chemistry). Actual performance parameters may vary based on sample type, sample quality, and clusters passing filter.
Nov 22, 2018
Mount disks with HFS+ volumes ( used in Mac OS) in CentOS
http://opensysblog.directorioc.net/2015/07/centos-mount-disks-with-hfs-volumes.html
https://www.centos.org/forums/viewtopic.php?t=67360
https://askubuntu.com/questions/332315/how-to-read-and-write-hfs-journaled-external-hdd-in-ubuntu-without-access-to-os
use force option to activate read-write mode
https://www.centos.org/forums/viewtopic.php?t=67360
https://askubuntu.com/questions/332315/how-to-read-and-write-hfs-journaled-external-hdd-in-ubuntu-without-access-to-os
$ sudo rpm --import https://www.elrepo.org/RPM-GPG-KEY-elrepo.org$ sudo rpm -Uvh http://www.elrepo.org/elrepo-release-7.0-2.el7.elrepo.noarch.rpm
$ sudo yum install kmod-hfsplus$ sudo yum install kmod-hfs$ sudo yum install hfsplus-tools
after install, you might need reboot use force option to activate read-write mode
$ sudo mount -t hfsplus -o force -o rw /dev/sdc2 /media/disk1/
Subscribe to:
Posts (Atom)