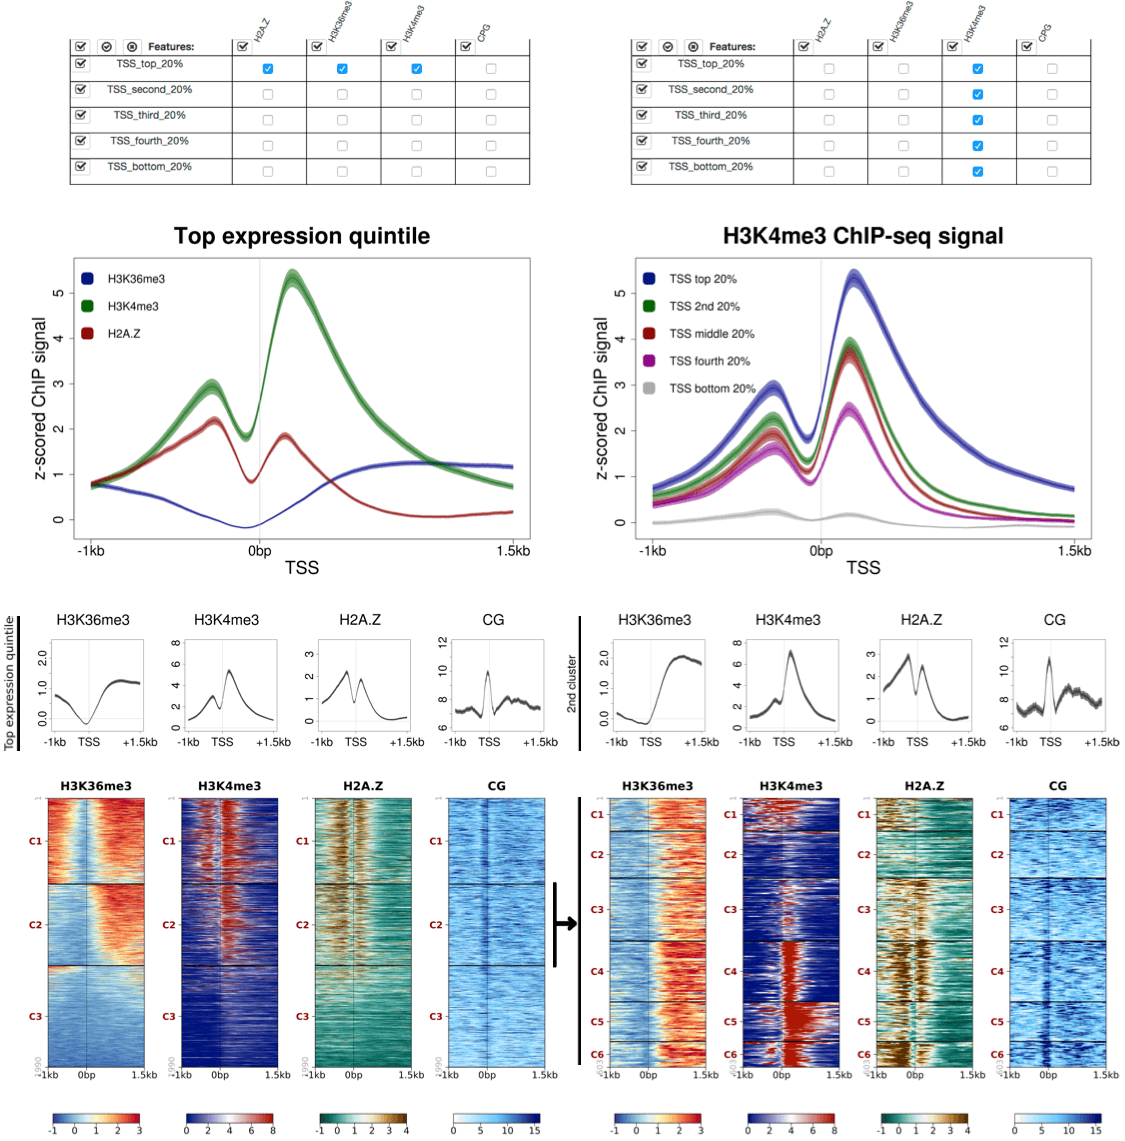
SeqPlots is a web browser tool for plotting average track signals (e.g. read coverage) and sequence motif densities over user-specified genomic features.
Standalone versions of SeqPlots are available as a Mac OS X (10.6 or higher) app bundle combing R, all required packages and scripts([subproject home]) or as an R package ([subproject home]).

No comments:
Post a Comment